
Upload Label Predictions with our Python API
In our latest Blog post we introduced the “Import Label” feature which allows DataGym users to import their annotated image data directly into their DataGym Projects. The feature enables users to inspect and evaluate the results of their prediction models from within DataGym. This article aims to give a real-life example of how to use the “Import Labels” feature with our Python API. The code samples in this guide are also available as a Jupyter Notebook on GitHub.
Check it out and register your DataGym account here – it’s free!
Use Case
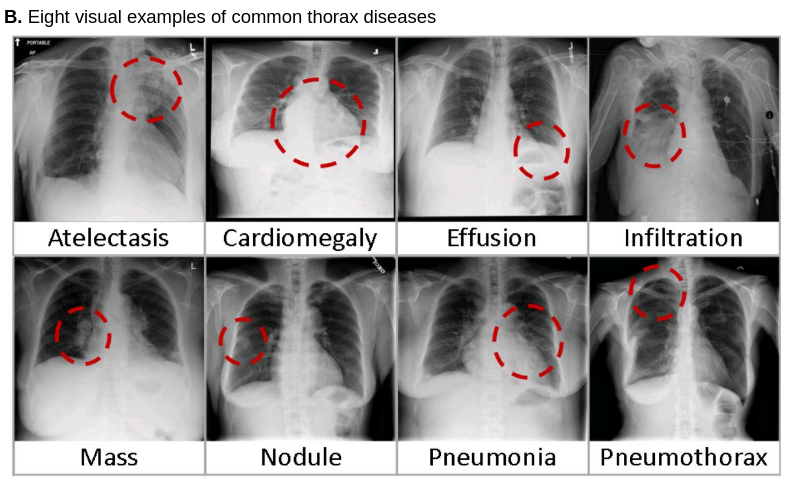
In their cutting-edge paper, Wang et al. [1] presented a new chest X-ray database, namely “ChestX-ray8”, which comprises 108,948 frontal-view X-ray images of 32,717 unique patients with the text-mined eight disease image labels (where each image can have multi-labels). They demonstrated that commonly occurring thoracic diseases can be spatially-located via their unified weakly-supervised multi-label image classification and disease localization framework.
Wang et al. made their findings and resources publicly available to other researchers. Their datasets contain frontal-view chest X-ray PNG images as well as coordinates for bounding boxes that identify the location of the detected thoracic diseases. In this tutorial, we use a subset of their ímages and annotated label-data to create a project in DataGym that imports and combines these resources. We chose this use case to demonstrate that DataGym can be used to import pre-labeled images that are the outcome of a prediction model. After the data is imported into a Project, DataGym allows its users to easily inspect and re-evaluate the predicted labels. Thereby, there is no more need to start labeling images from scratch, labelers have now the reduced task of correcting pre-labeled images.
In total, we will upload a subset of 880 images and 984 annotations into a DataGym Project.
Starting Point
We start with the resources provided by Wang et al.:
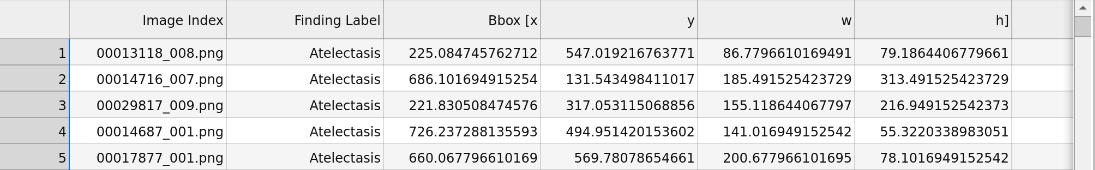
- A .csv file that contains the bounding boxes, which identify the location of thorax diseases in X-ray images. Preview:
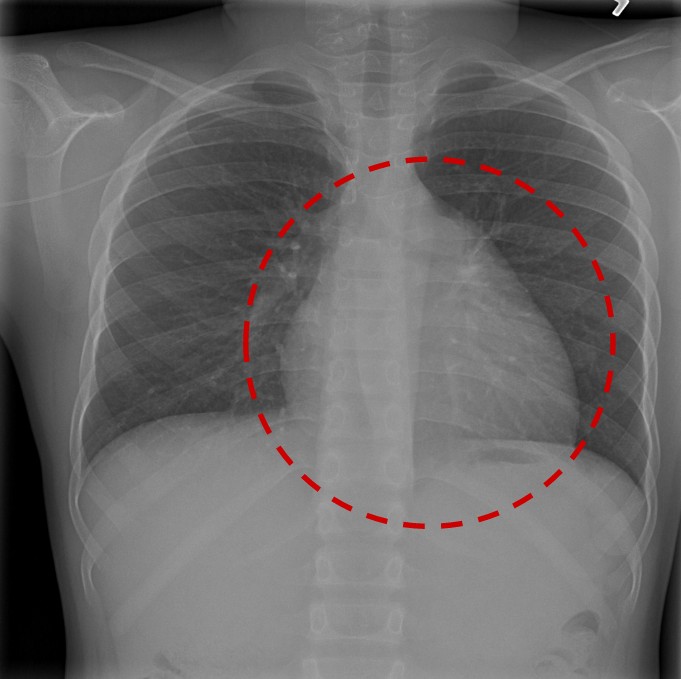
- A set of 880 X-ray images. In this example image we already marked the predicted location of the disease with a red circle:
Goal
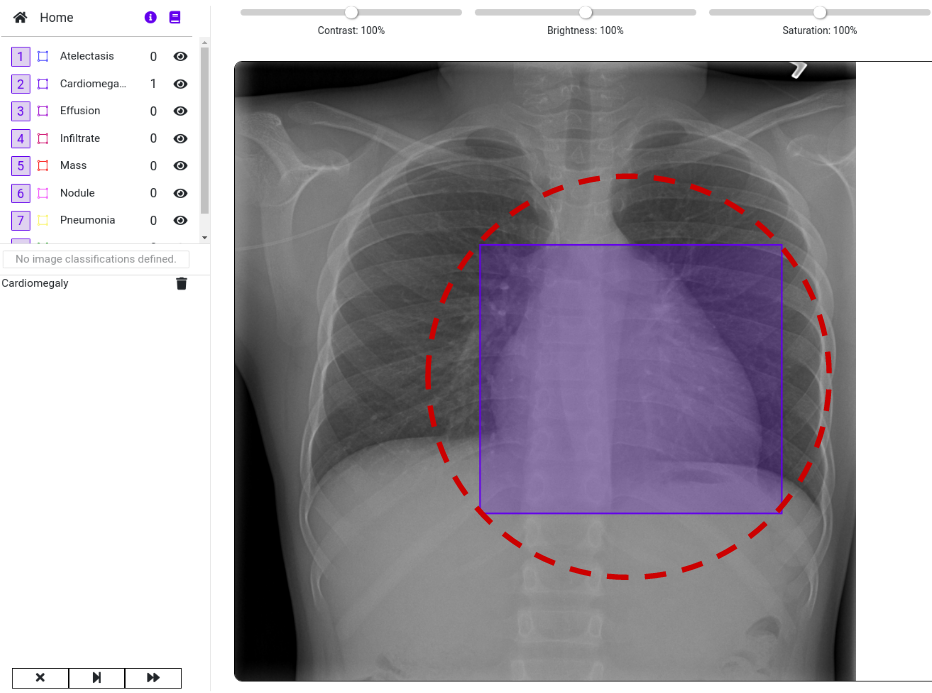
Our goal is to import the images and the labeled data into a DataGym Project. This allows the labelers to view the predicted diseases and to correct the size and location of the labels if necessary. Instead of labeling images from scratch, labelers have now the reduced task of correcting pre-labeled images. As you can see in the image below, we imported both the image and its respective label. Thereby, we directly depict the bounding box from the .csv file to identify the affected region in the X-ray image.
References
[1] Wang, Xiaosong, et al. “Chestx-ray8: Hospital-scale chest x-ray database and benchmarks on weakly-supervised classification and localization of common thorax diseases.” Proceedings of the IEEE conference on computer vision and pattern recognition. 2017.
Import the Data
We use Pandas’ DataFrames to read and process the prepared data from the .csv file.
import pandas as pd

csv_online = "https://media.datagym.ai/blog/chestxray/BBox_List_2017.csv"

df = pd.read_csv(csv_online)
print("Number of rows: {}".format(len(df)))
print("Number of images: {}\n".format(len(df['Image Index'].unique())))

df.head()| Image Index | Finding Label | Bbox [x | y | w | h] | Unnamed: 6 | Unnamed: 7 | Unnamed: 8 | |
|---|---|---|---|---|---|---|---|---|---|
| 0 | 00013118_008.png | Atelectasis | 225.084746 | 547.019217 | 86.779661 | 79.186441 | NaN | NaN | NaN |
| 1 | 00014716_007.png | Atelectasis | 686.101695 | 131.543498 | 185.491525 | 313.491525 | NaN | NaN | NaN |
| 2 | 00029817_009.png | Atelectasis | 221.830508 | 317.053115 | 155.118644 | 216.949153 | NaN | NaN | NaN |
| 3 | 00014687_001.png | Atelectasis | 726.237288 | 494.951420 | 141.016949 | 55.322034 | NaN | NaN | NaN |
| 4 | 00017877_001.png | Atelectasis | 660.067797 | 569.780787 | 200.677966 | 78.101695 | NaN | NaN | NaN |
As you can see, this is a bit messy. Therefore, we start by removing the unnecessary columns and changing the column names into a more readable format.
df = df.iloc[:,:6]  # select columns with content
df.columns = ['image_name', 'label', 'x', 'y', 'w', 'h']

df.head()| image_name | label | x | y | w | h | |
|---|---|---|---|---|---|---|
| 0 | 00013118_008.png | Atelectasis | 225.084746 | 547.019217 | 86.779661 | 79.186441 |
| 1 | 00014716_007.png | Atelectasis | 686.101695 | 131.543498 | 185.491525 | 313.491525 |
| 2 | 00029817_009.png | Atelectasis | 221.830508 | 317.053115 | 155.118644 | 216.949153 |
| 3 | 00014687_001.png | Atelectasis | 726.237288 | 494.951420 | 141.016949 | 55.322034 |
| 4 | 00017877_001.png | Atelectasis | 660.067797 | 569.780787 | 200.677966 | 78.101695 |
This looks much better!
Prepare the Resources in DataGym
Before we can import our labeled data into DataGym, we need to create a Project and set a Label Configuration. If you have any trouble following these steps, please visit DataGym’s documentation.
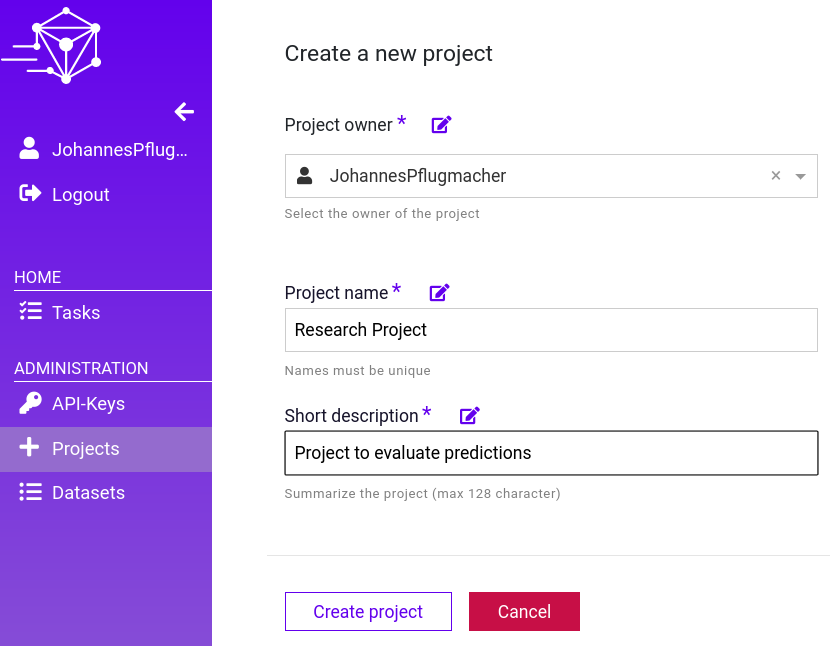
Create a Project
Creating a Project in DataGym is rather simple. Sign in to your account and create a Project named ‘Research Project‘
Create a Label Configuration
In order to import annotated data into your Project, you need to define a Label Configuration first. The Label Configuration defines which labels and classifications are available in a Project. You can define geometries for labeling, attach classifications to them or create global classifications for more general questions.
In our case, we will create a geometry for each label from our .csv file. These labels are:
- Atelectasis
- Cardiomegaly
- Effusion
- Infiltrate
- Mass
- Nodule
- Pneumonia
- Pneumothorax
You can also print these labels to check if the list is complete.
print(df['label'].unique())output:
['Atelectasis' 'Cardiomegaly' 'Effusion' 'Infiltrate' 'Mass' 'Nodule'
 'Pneumonia' 'Pneumothorax']
Follow the steps below to create a Label configuration
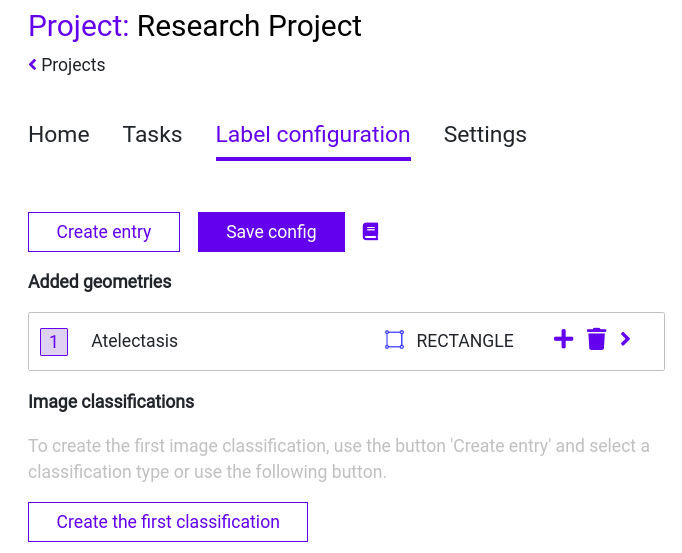
Step 1: Navigate to the “Label configuration” tab within your “Research Project”
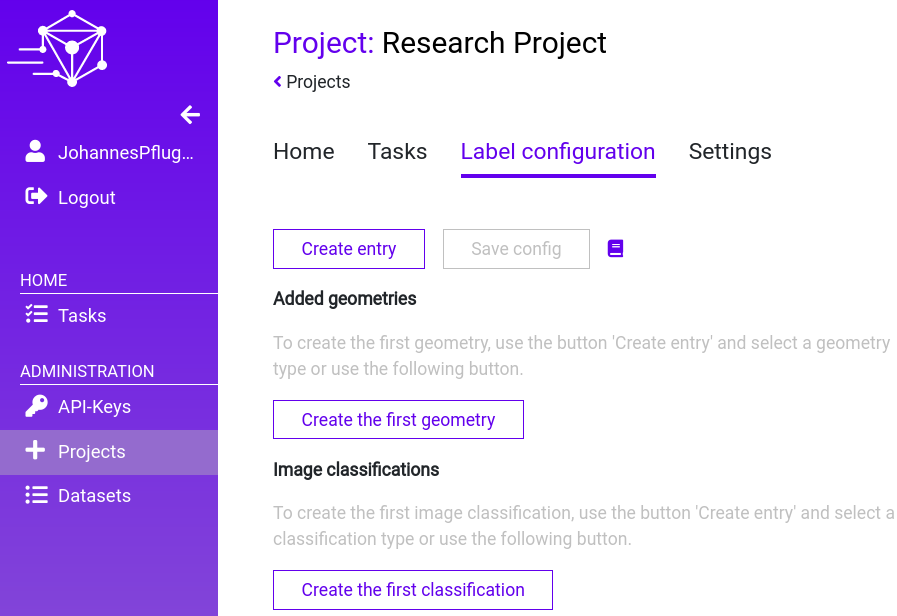
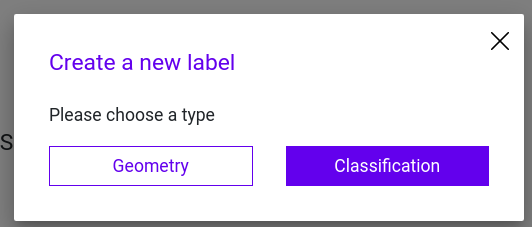
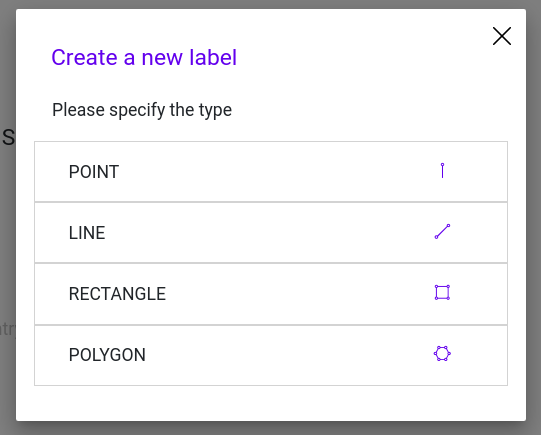
Step 2: Add a Geometry to your Label configuration and choose a rectangle
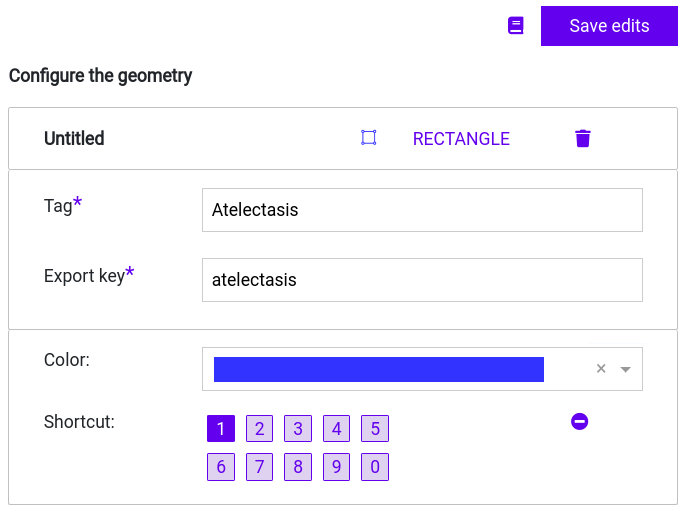
Step 3: Enter the first label name as key in your new Geometry. Then, click on “Save edits” to save you label entry.
You can choose a color and shortcut to better distinguish between your annotations.
Step 4: Click on “Save config” to save your Label Configuration.
Step 5: Add the remaining labels from the list. The result should look like this:
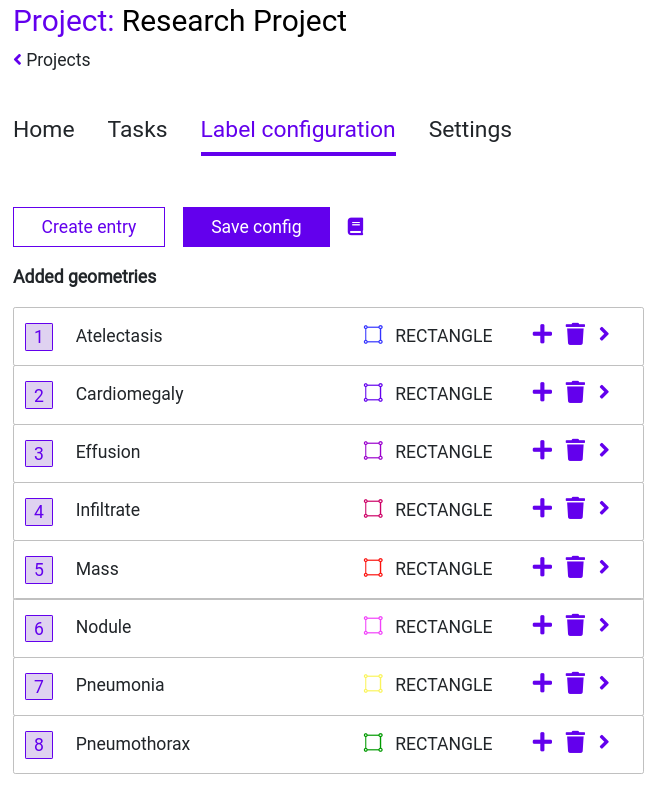
Don’t forget to save your configuration!
Create a Dataset
In order to upload images to our Project, we need to create a Dataset that can hold the images from our annotated data. This time we can use the Python API to quickly generate a Dataset directly from a Jupyter Notebook. Therefore, we need the following Client methods:
Client.create_dataset(name, short_description)If this is your first time using the Python API, please visit our Getting Started Guide.
from datagym import Client

# create a client
client = Client("<API_KEY>")

# create a dataset for the x-ray scans
client.create_dataset(name="xray_images",
                      short_description="Chest X-ray")
output:
<Dataset {'id': 'ee6115ec-bfc4-4a9f-8ee4-5037b771c90e',
          'name': 'xray_images',
          'short_description': 'Chest X-ray',
          'timestamp': '1586174249366',
          'owner': '3360f10f-a5ab-48a6-966c-cdba2d63116a',
          'images': <List[Image] with 0 elements>}>
We easily created a Dataset via Python. But there aren’t any images in this Dataset yet.
Upload Images to the Dataset
Prepare a list with image URLs
To upload images, we need a list of URLs that reference all of the annotated images. The images are stored on our website: “https://media.datagym.ai/blog/chestxray/images/”. Since we already know the image names from our .csv file, we can easily combine the “image_name” column with our image server path. Thereby, we can generate a URL list that links all the images from our .csv file.
image_url_path = "https://media.datagym.ai/blog/chestxray/images/"

image_urls = image_url_path + df['image_name']  # combine the Server path and image names

image_url_set = set(image_urls)  # convert numpy array into python set

print("Number of URLs: {}".format(len(image_url_set)))
print("Example URL: {}".format(list(image_url_set)[0]))
output:
Number of URLs: 880
Example URL: https://media.datagym.ai/blog/chestxray/images/00027278_007.png
Upload the URL list
Now we can upload the images to our Dataset. Therefore, we use the Client class of the Python API.
Client.create_images_from_urls(dataset_id, image_url_set)dataset = client.get_dataset_by_name("xray_images") # fetch the dataset from DataGym
upload_results = client.create_images_from_urls(dataset_id=dataset.id,
image_url_set=image_url_set)
print(upload_results[0])output:
{'internal_image_ID': 'bf496881-cb06-443b-a1b3-ee306dcb2a3b',
 'external_image_ID': '00020819_002.png',
 'imageUrl': 'https://media.datagym.ai/blog/chestxray/images/00020819_002.png',
 'imageUploadStatus': 'SUCCESS'}
DataGym returns a success message for each uploaded image. The response contains the internal_image_IDs which are later needed as a reference to upload the annotated data into DataGym’s Datasets.
Create an internal image ID reference Dictionary
In the next step, we create a Dictionary that maps the internal image ID to the image name from our .csv file. This is needed to identify the images in our DataGym Project when we upload our annotated image data.
image_ids_dict:

        Dict[image_name] = internal_image_id
There are two ways to generate this Dictionary.
1. By using the response data from the image upload:
image_ids_dict = dict()

for image_response in upload_results:
    if image_response["imageUploadStatus"] == "SUCCESS":
        image_ids_dict[image_response["external_image_ID"]] = image_response["internal_image_ID"]
2. By using the Images from your Dataset
# Fetch your Dataset
dataset = client.get_dataset_by_name(dataset_name="xray_images")

image_ids_dict = dict()

for image in dataset.images:
    image_ids_dict[image.image_name] = image.id
Connect the Dataset to the Project
We already created a Dataset and filled it with our images. The only thing that’s left is to connect this dataset to our Research Project. The Python API provides a simple method to add a Dataset:
Client.add_dataset(dataset_name, project_name)# Fetch the Research Project and the CT Scan Dataset
dataset = client.get_dataset_by_name(dataset_name="xray_images")
project = client.get_project_by_name(project_name="Research Project")
client.add_dataset(dataset_id=dataset.id, project_id=project.id)Prepare the upload of annotated image data
We want to upload the annotated image data from our .csv file to our DataGym Project. DataGym uses a specific format for annotated data imports. Therefore, we have to convert our rows from the .csv file into this specific form.
Understand the schema
Before we start, let’s have a look at our .csv again.
df.head()| image_name | label | x | y | w | h | |
|---|---|---|---|---|---|---|
| 0 | 00013118_008.png | Atelectasis | 225.084746 | 547.019217 | 86.779661 | 79.186441 |
| 1 | 00014716_007.png | Atelectasis | 686.101695 | 131.543498 | 185.491525 | 313.491525 |
| 2 | 00029817_009.png | Atelectasis | 221.830508 | 317.053115 | 155.118644 | 216.949153 |
| 3 | 00014687_001.png | Atelectasis | 726.237288 | 494.951420 | 141.016949 | 55.322034 |
| 4 | 00017877_001.png | Atelectasis | 660.067797 | 569.780787 | 200.677966 | 78.101695 |
Every row in this table represents an annotated segment in an image. DataGym can add these annotations to its Project images when a specific JSON format is used. As an example we take the first row of the table above and convert it to valid DataGym JSON:
 {
    "internal_image_ID" : "ebfbc807-5c52-431c-8f23-28a70f66488c",
    "keepData": false,
    "global_classifications" : {},
    "labels" : {
        "atelectasis" :  [
                   {
                     "geometry" : [ { "x" : 225.084746,
                                      "y" : 547.019217,
                                      "h" : 86.779661,
                                      "w" : 79.186441  } ],
                     "classifications" : {  }
                   }
                 ]
               }
}| Property | Description |
|---|---|
| internal_image_ID | The internal ID to identify the image.
In order to address the correct image we have to replace the image name from our .csv with the internal image ID of our Dataset. For this case, we already prepared the image_ids_dict to get these internal image IDs by their image name. |
| keepData | If keepData is equal to false, all already existing labels for the current Image will be deleted after the labels upload. If keepData is equal to true, all new labels will be added to the already existing labels for the current Image. Default value for keepData is true |
| global_classifications | It can be left empty because we haven’t defined any additional global classifications in our Label configuration. |
| labels | A label describes a geometry within an image.
As you can see, the annotated image segments end up in the labels attribute. Remember that we defined a Geometry in our DataGym Project for every label of our .csv file. One of these labels is ‘atelectasis’, which we created as a rectangle. |
| geometry | The geometry attribute contains the coordinates of the annotated segment. |
| classification | The attribute named classifications can be left empty because we haven’t defined any additional classifications in our Label configuration. |
Convert the .csv into DataGym JSON
Follow this step-by-step guide to create the DataGym JSON from the .csv file
1. Create a Dictionary template for annotated data
First, we need to create a Dictionary that can hold all labels for every image in our .csv. Therefore, we define a nested Dictionary based on the image name and label. Since there can be multiple instances of annotated data (aka geometries) for each label, we initialize a (yet) empty list per label. The code snippet below results in a template Dictionary called __labels_per_image__ which has the following form:
    labels_per_image: Dict[image_name][label]


    labels_per_image =

        {
            'image_name': {
                               'label_1': [],
                               'label_2': [],
                               ...

                          }
        }
labels_per_image = {}
for index,row in df.iterrows(): # iterate over the DataFrame rows
image_name = row['image_name']
label = row['label'].lower() # label keys must be lower case
if image_name not in labels_per_image:
labels_per_image[image_name] = dict()
if label not in labels_per_image[image_name]:
labels_per_image[image_name][label] = list()
2. Create and Add Label Entries
We iterate a second time over the DataFrame to generate a Label Entry for every row in our .csv. A label_entry has the following form:
label_entry =

        {
         'geometry': [{'x': 343.438229166667,
                       'y': 446.198524305556,
                       'h': 53.4755555555556,
                       'w': 120.60444444444401}],
         'classifications': {}
        }
Then we add the Label Entries to our template Dictionary labels_per_image:
labels_per_image =

        {
            'image_name': {
                               'label_1': [label_entry_1, label_entry_2],
                               'label_2': [label_entry_3],
                               ...

                          }
        }
for index,row in df.iterrows():
rectangle = {
"x": row['x'],
"y": row['y'],
"h": row['h'],
"w": row['w'],
}
label_entry = {
"geometry": [rectangle],
"classifications" : { }
}
image_name = row['image_name']
label = row['label'].lower()
labels_per_image[image_name][label].append(label_entry)
# print last label entry as example
print(label_entry)output:
{'geometry': [{'x': 343.438229166667,
   'y': 446.198524305556,
   'h': 53.4755555555556,
   'w': 120.60444444444401}],
 'classifications': {}}
3. Generate and fill the final template
The final step is to create a list of Dictionaries that hold the image data and label data we defined above. At this point, we can recreate the schema introduced at the beginning of this section. The label_data Dictionary is created for each image in our DataFrame. It also uses the image_ids_dict to set the internal image IDs. The already formatted labels of the image can be set via the labels_per_image Dictionary.
    label_data =

        {
         "internal_image_ID" : image_ids_dict[image_name],
         "keepData": false,
         "global_classifications" : {},
         "labels" : { labels_per_image[image_name] }
        }
The only thing left to do is to create a list with all the labeled data. This List is now in a valid DataGym JSON format and contains all annotated image segments from the .csv file.
    label_data_list =

        [
            label_data_1,
            label_data_2,

            ...
        ]
label_data_list = []
for image_name in df['image_name'].unique(): # iterate over all image names
label_data = {}
label_data['internal_image_ID'] = image_ids_dict[image_name]
label_data["keepData"] = False
label_data['global_classifications'] = {}
label_data['labels'] = labels_per_image[image_name]
label_data_list.append(label_data)Look at the last label_data object to get an example of the final form after the conversion:
import pprint

pprint.pprint(label_data)
output:
{'internal_image_ID': '337f70f0-e03f-498e-be84-fc0dbdd1ae31',
 'keepData': False,
 'global_classifications': {},
 'labels': {'atelectasis': [{'classifications': {},
                             'geometry': [{'h': 53.4755555555556,
                                           'w': 120.60444444444401,
                                           'x': 343.438229166667,
                                           'y': 446.198524305556}]}]}}
Import the Annotated Data into the DataGym Project
Now we can finally import the annotated data from the .csv file to our DataGym Project. We only need to pass the label_data_list to the Python API Client.
Client.import_label_data(project_id, label_data)# fetch your Research Project first
project = client.get_project_by_name(project_name="Research Project")
errors = client.import_label_data(project_id=project.id,
label_data=label_data_list)
# return the list with possible errors (JSON Format, label keys/values, etc.)
print(errors) Inspect your Results
Visit DataGym to inspect your labeled images. As you can see in the image below, we imported both the image and its respective label. Thereby, we directly depict the bounding box from the .csv file to identify the affected region in the X-ray image. Feel free to browse through the images within your Project to see more examples. There are also multiple ways to design your own Label configuration for your own Projects. We recommend using this real-life example to further explore the functionalities of DataGym and its Python API.
This is it! You imported 880 images and 984 labels into your DataGym Project using our Python API. Now you can evaluate the labeled data by adjusting misplaced labels or adding labels that were missing. There is no more need to start labeling new images from scratch, labelers now have the reduced task of correcting pre-labeled images. Thereby, you can save time labeling and quickly improve your prediction models. DataGym also supports team workflows, so that many labelers are able to work on the same project at the same time.
Check it out and register your DataGym account here – it’s free!
We hope you enjoyed our article. Please contact us if you have any suggestions for future articles or if there are any open questions.